
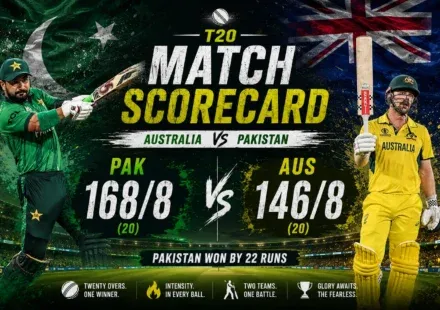
A cricket scorecard can explain many things that the final result leaves unclear. cricketscore.it.com gives readers another place to explore cricket scores, innings details, player performances, and useful scorecard information. The final result might say that one side won comfortably, but the numbers underneath can show a much more complicated match. A team can lose early wickets and recover through one long partnership, or score quickly at first and then slow down badly. Bowling figures can reveal pressure that was not obvious while watching casually. Extras can even become important when the difference between two teams is very small. Reading these details does not require expert knowledge, although knowing what each section means makes the process much easier.
Check The Match Setting
The first thing worth checking on any scorecard is the basic match information. This usually includes the teams involved, competition name, venue, date, and format being played. These details affect how the numbers should be understood because Test cricket operates very differently from T20 cricket. A score of 180 can represent a strong total in one situation and a modest total in another match. The venue can also matter because pitch behavior, weather, and boundary dimensions may influence scoring. Knowing whether the match is part of a tournament, bilateral series, or knockout competition provides additional context. This information may look simple, but ignoring it can lead to confusing comparisons later when statistics from different matches are placed together.
Read The Toss Details
The toss section gives a small amount of information about how the match started. The captain winning the toss may choose to bat or field depending on conditions, format, weather, and expectations about the pitch. The decision itself does not explain the eventual result, but it helps establish the order of the innings. In longer matches, teams can think about how the pitch might change during later sessions. In shorter matches, captains may consider whether chasing under lights could create different conditions. Readers should avoid treating the toss decision as proof that one team made the correct choice. Instead, it simply provides useful background before examining what happened after the first ball.
Watch Opening Partnerships
Opening partnerships can establish the direction of a batting innings before the middle order becomes involved. Two openers may score quickly and create early momentum, or they may concentrate on protecting their wickets during difficult conditions. The scorecard can show how many runs were added before the first dismissal and which players were involved. A long opening partnership may reduce pressure on the following batters because fewer wickets are already lost. A quick wicket can have the opposite effect, particularly when the bowling side is creating movement or bounce. Opening scores should therefore be considered alongside the number of balls faced and the overall scoring rate. This gives readers a clearer picture of how the innings began.
Follow Scoring Through Phases
An innings rarely progresses at exactly the same scoring rate from beginning to end. Teams often change their approach depending on wickets, available overs, fielding restrictions, and the quality of bowling. A side might score carefully during the opening period and then increase its scoring during the middle overs. Another team may attack early but slow down after losing important batters. Looking at over-by-over information can reveal these changes more clearly than the final total alone. Run rate provides a simple way to describe scoring pace, although it should be connected with wickets and remaining deliveries. A high run rate with several wickets lost can create a very different situation from the same run rate with most batters still available.
Check Batting Positions
The position listed beside a batter can provide useful context when looking at individual scores. Openers generally face different conditions from middle-order players, while lower-order batters may enter with only a small number of overs remaining. A score of 40 runs can therefore represent very different responsibilities depending on where and when the batter entered. The scorecard may not explain every tactical decision, but batting order provides an important clue. Readers can also compare the number of balls faced with the player’s final score to understand how quickly the innings developed. This prevents simple comparisons where every run is treated as if it came under identical circumstances. Cricket roles are rarely that straightforward.
Look At Boundary Timing
Fours and sixes provide useful information about how a batter reached their score. However, the total number of boundaries does not tell the entire story because their timing within the innings can also matter. A batter may begin with controlled singles before hitting several boundaries during a later acceleration. Another player might hit boundaries early but then struggle against changing bowling conditions. When detailed over information is available, readers can connect boundary periods with changes in scoring rate. This helps explain when a batting side started taking greater risks. Boundary counts become more meaningful when they are considered alongside balls faced, wickets available, and the number of overs still remaining.
Understand Bowling Roles
Every bowler has a particular role within the larger bowling plan, although that role can change during the match. Opening bowlers may receive the new ball and attempt to create early wickets. Spinners might be introduced during middle overs when controlling the scoring rate becomes important. Death-over specialists can be used near the end of limited overs innings when batters are trying to score quickly. The scorecard shows overs, runs, wickets, and economy rate, but those figures need to be viewed according to when the bowler actually operated. A bowler conceding 40 runs may have faced a much more aggressive batting period than someone conceding the same number during quiet early overs.
Study Economy Alongside Wickets
Wickets usually attract immediate attention on a bowling scorecard, but economy rate can tell another part of the story. A bowler taking one wicket while conceding very few runs may have created sustained pressure throughout a spell. Another bowler might take three wickets while giving away many runs during aggressive attacking periods. Neither set of figures should be understood without considering the role and match situation. Economy rate describes the average number of runs conceded per over, while wickets describe successful dismissals credited to the bowler. Looking at both together gives readers a broader picture. Overs bowled and the timing of the spell can provide even more useful context.
Notice Partnership Breaks
When a partnership ends, the scorecard can reveal an important change in the innings. A batting pair may have added enough runs to stabilize the team after early wickets. Their dismissal can then expose newer batters to the same bowling attack under different pressure. Partnership figures can be especially useful when a team experiences a collapse shortly after one major stand ends. In other cases, the fall of one batter may bring another player to the crease who continues the scoring at an even faster pace. The important point is that partnerships create stages within an innings. Looking at those stages helps explain why the final total developed in a particular way.
Check Extras Before Comparing
Extras should be checked before comparing the batting totals of two teams. Wides, no balls, byes, and leg byes all contribute to the team score, but they are recorded separately from batter runs. A team receiving many extras can increase its total without producing an equivalent amount of scoring through batsmen. In a close match, these additional runs can become surprisingly important. Wide deliveries can also provide another ball when the rules require the bowler to deliver again. No balls can sometimes create additional scoring opportunities depending on what happens during the delivery. Understanding extras helps readers see why the team total may be larger than the combined individual batting scores.
Read Wicket Patterns
The number and timing of wickets can often explain why an innings changed direction. Losing one wicket after a strong start may have little effect, while losing several wickets within a short period can create serious pressure. A scorecard’s fall of wickets section can show exactly when these changes occurred. Readers can compare each dismissal with the following partnership to see whether the team recovered quickly. If the next partnership adds very few runs, the original wicket may have started a larger collapse. If a long stand follows, the team may have recovered effectively. This simple comparison makes the fall of wickets section much more useful than simply counting how many dismissals occurred.
Understand Chasing Pressure
A second innings scorecard needs slightly different attention because the batting side has a specific target to reach. The number of runs still required and the deliveries remaining can change the meaning of every new score. Required run rate provides a useful indication of the pace needed to complete the chase within the available overs. However, wickets remaining are equally important because a team with fewer batters available may struggle to maintain an aggressive scoring rate. A chase can therefore look comfortable at one stage and become difficult several overs later. Looking at runs, wickets, overs, and required rate together gives a much more realistic understanding of chasing pressure.
Compare First And Second Innings
Comparing the two innings can reveal why the final result happened in a way that one innings alone cannot explain. A team may score 220 in the first innings and appear to have produced a modest total. The second innings might then show that the pitch became harder to score on or that the bowling side controlled the chase extremely well. Conversely, a lower first-innings total can become surprisingly competitive if the chasing team struggles with early wickets. Comparing batting scores, bowling figures, extras, and scoring rates creates a more complete picture. This is especially useful when the final winning margin appears much closer than expected from the individual batting totals.
Check Fielding Contributions
Fielding statistics can provide useful information even though they receive less attention than batting and bowling figures. Catches, stumpings, and run outs can directly contribute to dismissals during an innings. A wicketkeeper may collect several catches or complete a stumping, while an outfielder may create an important run out through quick movement and accurate throwing. Some fielding contributions cannot be represented easily by standard numbers, such as stopping boundaries or saving several runs. Still, the recorded dismissals provide evidence about who completed important moments. Looking at these details prevents the scorecard from becoming entirely focused on batters and bowlers. Cricket remains a team sport, and fielding forms an important part of that record.
Use Format Specific Context
Scorecard statistics should always be interpreted according to the format of the match. Test cricket allows longer innings and can involve multiple innings for each team. One Day International matches provide a fixed number of overs, while T20 matches create much shorter periods for scoring and recovery. A strike rate that appears slow in T20 cricket may have a completely different meaning in Test cricket. Bowling economy should also be viewed according to the format and role of the bowler. Comparing numbers without identifying the format can create misleading conclusions. Readers should therefore check the format before using scorecard figures to compare different players or matches.
Conclusion
A cricket scorecard becomes much more useful when readers examine how its different numbers connect with one another. Opening partnerships, scoring phases, batting positions, boundaries, bowling roles, economy rates, extras, wicket patterns, fielding contributions, and chasing pressure all provide separate pieces of match information. cricketscore.it.com can provide additional cricket information for readers interested in scorecards, player performances, innings statistics, and match records. The final result is only one part of the record because the detailed figures explain how the teams reached that result. With regular practice, readers can use scorecards to understand the structure and changing pressure of a cricket match much more clearly.
Read also :-
england cricket team vs australian men’s cricket team timeline